←
Illia [ilˈiə] Kuzminov
CX/UX researcher.
4+ years into Research and DesignOps. Specializing in the end-to-end cycle of research, integrating data-driven approaches into product strategies. Expertise spans project and product management, art direction, and data analysis.

Mapping Client Experience into Gambling Domain
/CONTEXT
The company needed to synchronize the vision of internal processes and the understanding of the customer journey and experience between departments. This was essential to enable the optimal development and implementation of new solutions.
/TEAM
CEO, CPO, PO, CMO, CCO, CFO, PMs, Design Lead, Head of Data Analytics, Head of Customer Retention, Head of Customer Support Monitoring, Head of Customer Satisfaction, Frontend and Backend Leads, Head of Sport department, Head of Games department, Lawyers.
/TOOLS
Figma, Miro, Google Analytics (GA3, GA4), Hotjar, Maze, Excel, Qualtrix, SurveyMonkey, Power BI, Call Center
/RESULTS
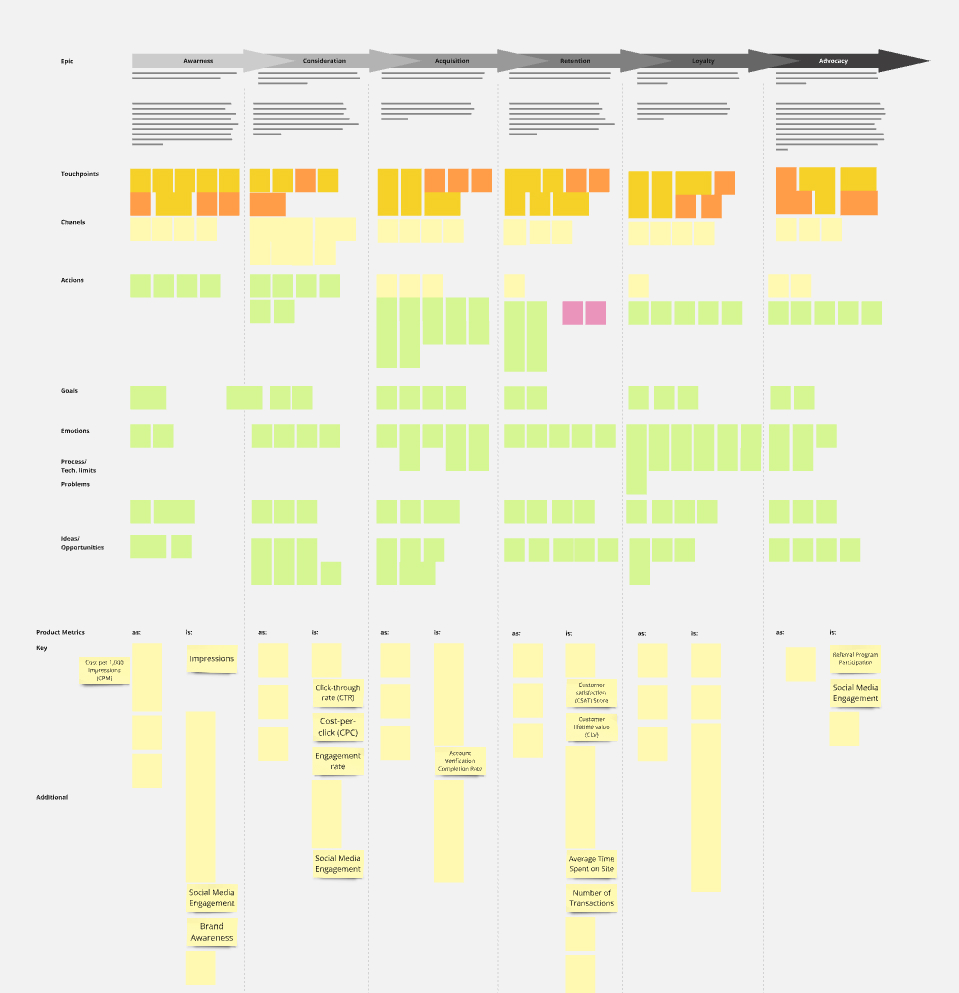
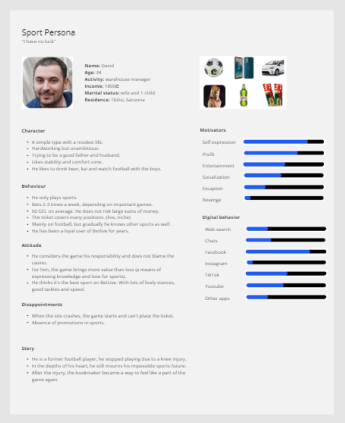
— Developed working CJM and Customer Personas, aligning the understanding of the customer's mental model across departments.
— Formulated a strategic backlog and prioritized tasks.
— Increased LTV by 23% post-implementation of key changes.
— Enhanced Retention Rate and Stickiness (DAU/WAU/MAU) in the most valuable customer segments.
— Reduced average transaction completion time by 34% and error rates by 40%.
— Created a Service Blueprint, optimizing processes and communication.
— Optimized the CRM system, reducing customer support inquiries by 30% per problem cluster.
— Established and automated a systematic reporting process in the Customer Satisfaction department.
/DELIVERED ARTIFACTS
— CJM/USM
— Service Blueprint
— Scenarios UML
— Customer Personas (proto & validated)
— Market/Competitor research
— Data analysis reports, heatmaps, categorized screen records
— Survey guides and summary reports
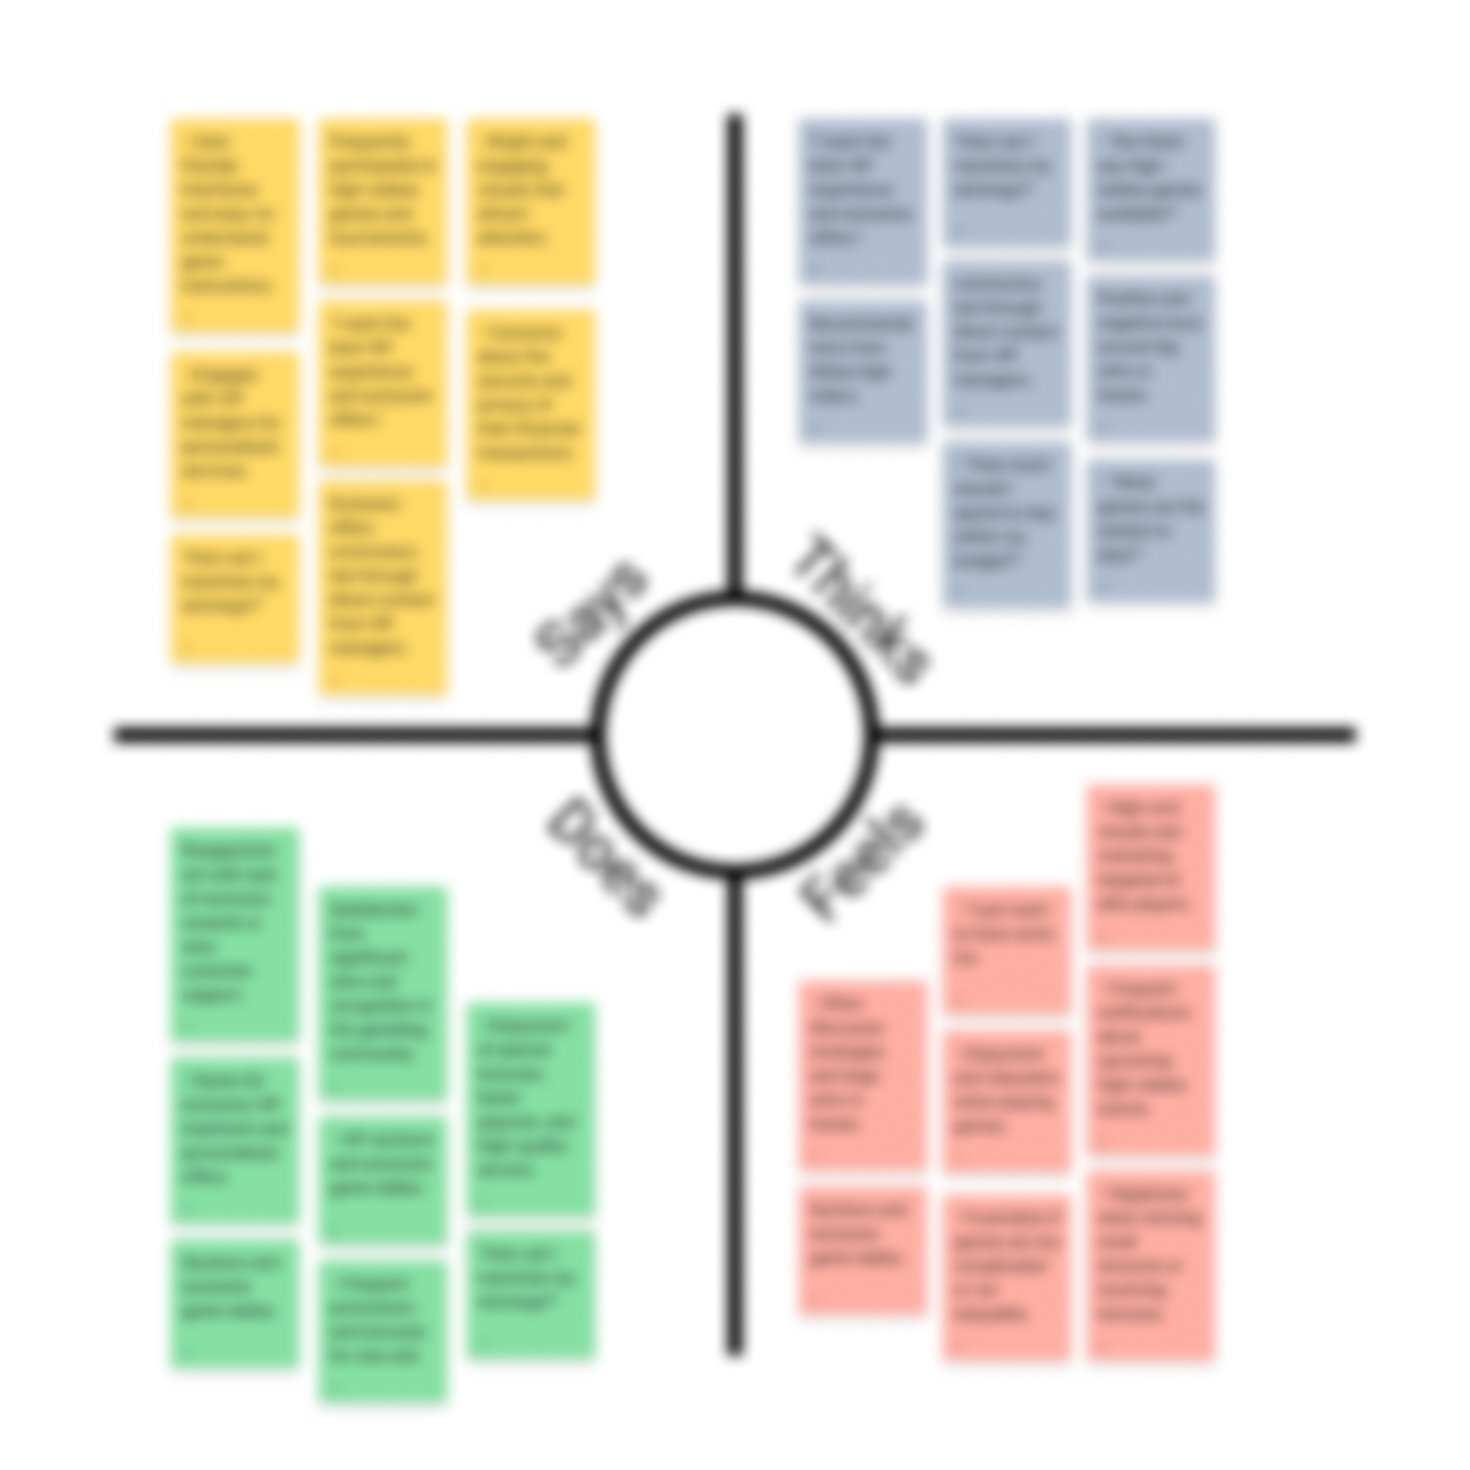
— JTBD statements, SWOT analysis, Empathy Map
— User flows, wireframes, interactive prototypes
— Usability Test plan and summary reports
— Heuristic evaluation reports, Accessibility audit report
— Design specification
— Implementation roadmaps and prioritization matrix
— Benchmarking reports
/RESEARCH PROCESS
The discovery phase started with engaging workshops with the participating multidisciplinary teams and other key stakeholders in the organization. We applied CJM methods to map each step, contact and feeling along the customer journey line. In this way, the team was able to capture subtle issues that pointed towards the most problematic areas and areas where customers’ satisfaction and loyalty could be improved.

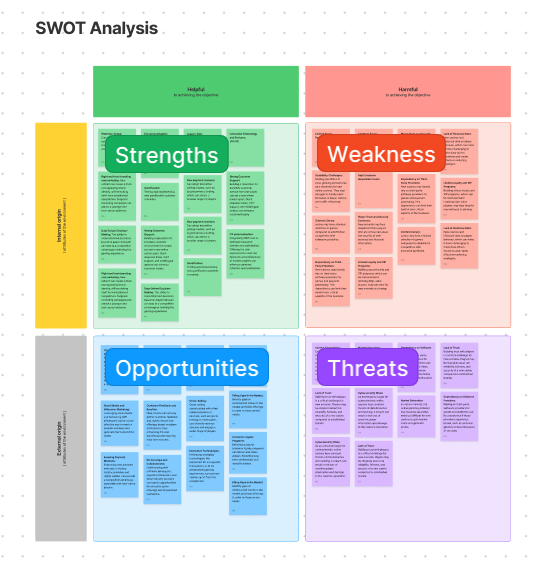
During the synthesis phase, we identified key problem clusters faced by users and developed a comprehensive understanding of their mental models: their expectations, reasons for choosing our product, and previous solutions they used. Together with key stakeholders, conducted a session and created a SWAT analysis based on the findings After synthesizing this information, I conducted an interim presentation for the CPO, PO, and PM. In this session, we prioritized tasks using an Impact/Cost matrix, after which I collaborated with the PO and PM to create a roadmap for implementing changes.

The next step was to test these hypotheses. We clustered potential solutions into several categories: business processes, customer experience, user experience, and visual design. For each category, we organized meetings with relevant department heads to discuss possible solutions. Once we consolidated the optimal solutions, we began the implementation process.

In the synthesis phase, we converted the extensive qualitative data into practical insights. To incorporate these findings, we conducted a SWOT analysis, aligning our strategic plan with the organization’s strengths and market opportunities while managing weaknesses and avoiding threats. This comprehensive approach ensured our strategic initiatives were grounded in both internal and external assessments.
The validation of the strategic hypotheses was done through the intensive usability testing and the consecutive prototyping. Together with the design team, we developed prototypes for user scenarios based on detailed specifications and tested them across various samples. We conducted both moderated and unmoderated testing sessions. By establishing relevant benchmark metrics in advance, we launched an iterative testing process to ensure that user feedback accurately validated our hypotheses. This way, the iterative approach facilitated the design update based on the user feedback, guaranteeing that the final designs were user-friendly, efficient, and relevant.

Using external industry standards and organization’s specific KPIs added quantitative aspect to the strategies and plans. The effectiveness of the improvements was quantified with relevant metrics, such as NPS, CSI, and other key operational targets. As well, this method of data analysis not only proved the efficacy of the strategic decisions made but also offered recommendations for secondary improvement.
The implementation phase during validation was on how to change the status quo and improve the organization on the basis of research findings. A Service Blueprint was created in order to map out the most efficient internal procedures and significant changes in the processes of offering services to customers. This blueprint acted as a guide to how cross functional teams should undertake the implementation of customer oriented strategies so that there was a harmony across organizational departments.
Specifically, complex CRM optimization strategies were applied to incorporate predictive analytics and machine learning. These technologies allowed such advantages as real-time customer data and individual approaches, as well as an effective and timely customer management system that could predict the customer’s needs before they occurred. Additional integration of the system with the widespread routine practices within the company helped optimize the processes by automating them and directing the attention of the staff to the more important aspects of the customer relations.
Throughout the project, we measured the effectiveness of our initiatives using key metrics such as NPS, Customer Satisfaction Index (CSI), and other operational targets. These metrics not only validated the success of our strategies but also provided insights for continuous improvement, ensuring the organization maintained a competitive edge in the market.
/RESULTS
— Increased NPS from near 0 to a range of 40-50 post-updates.
— Improved CSAT post-service usage from 20% to 65%, with consistent metrics for both active and newly acquired users.
— Raised the average CES by 2.5 points during user interactions after subscription and service booking.
— Boosted landing page conversion rates by 30% within the first month of the redesign.
— Reduced bounce rates on internal pages by 25% due to enhanced navigation and content structure.
— Decreased customer support inquiries by 40% following the implementation of new guidelines and the check-in program at partner centers.